Projects
VaxViz
Colorado COVID-19 Updates
About
Contact
Lindsay Diamond
Projects
VaxViz
Colorado COVID-19 Updates
About
Contact
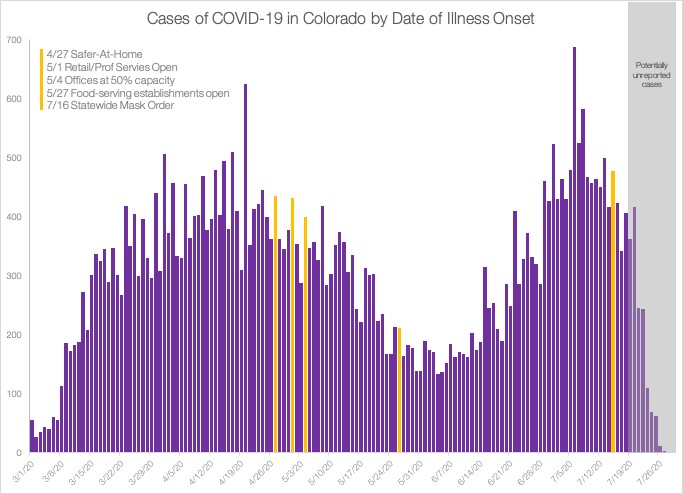
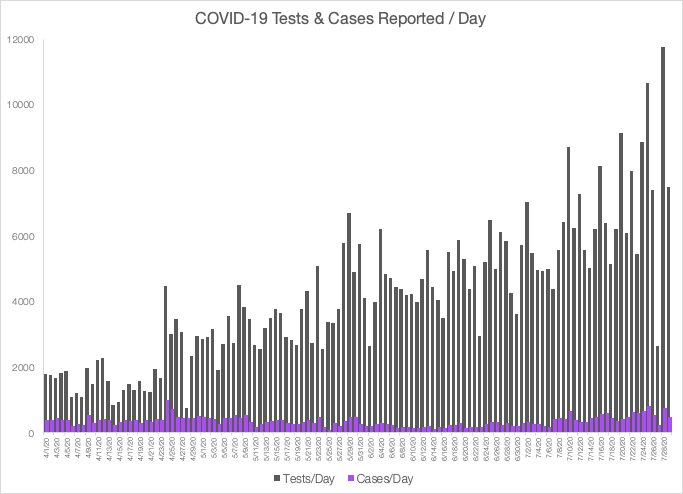
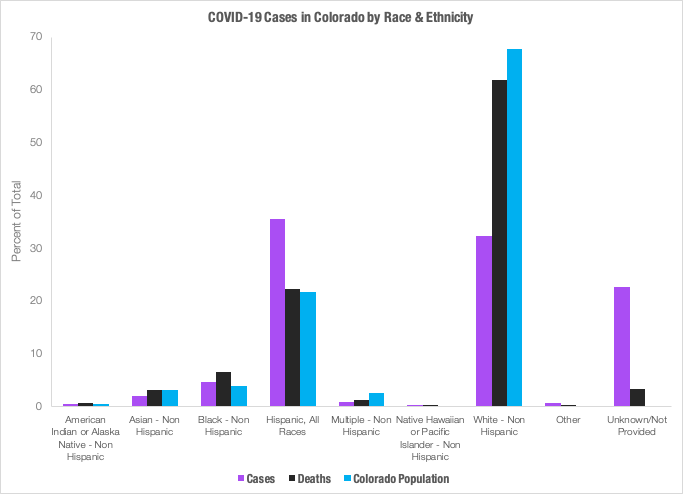
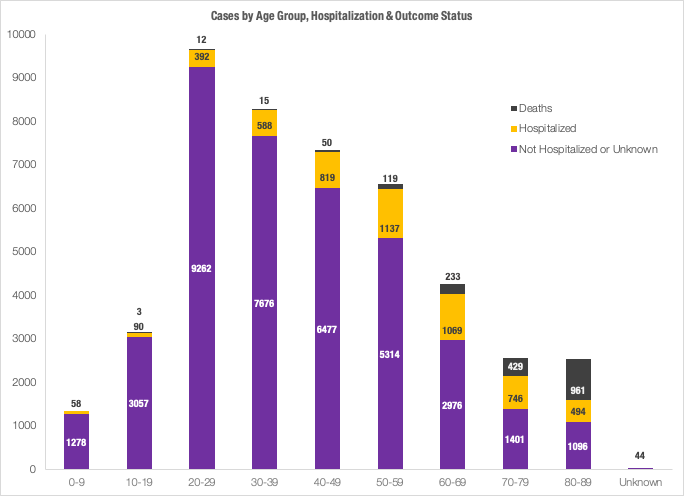
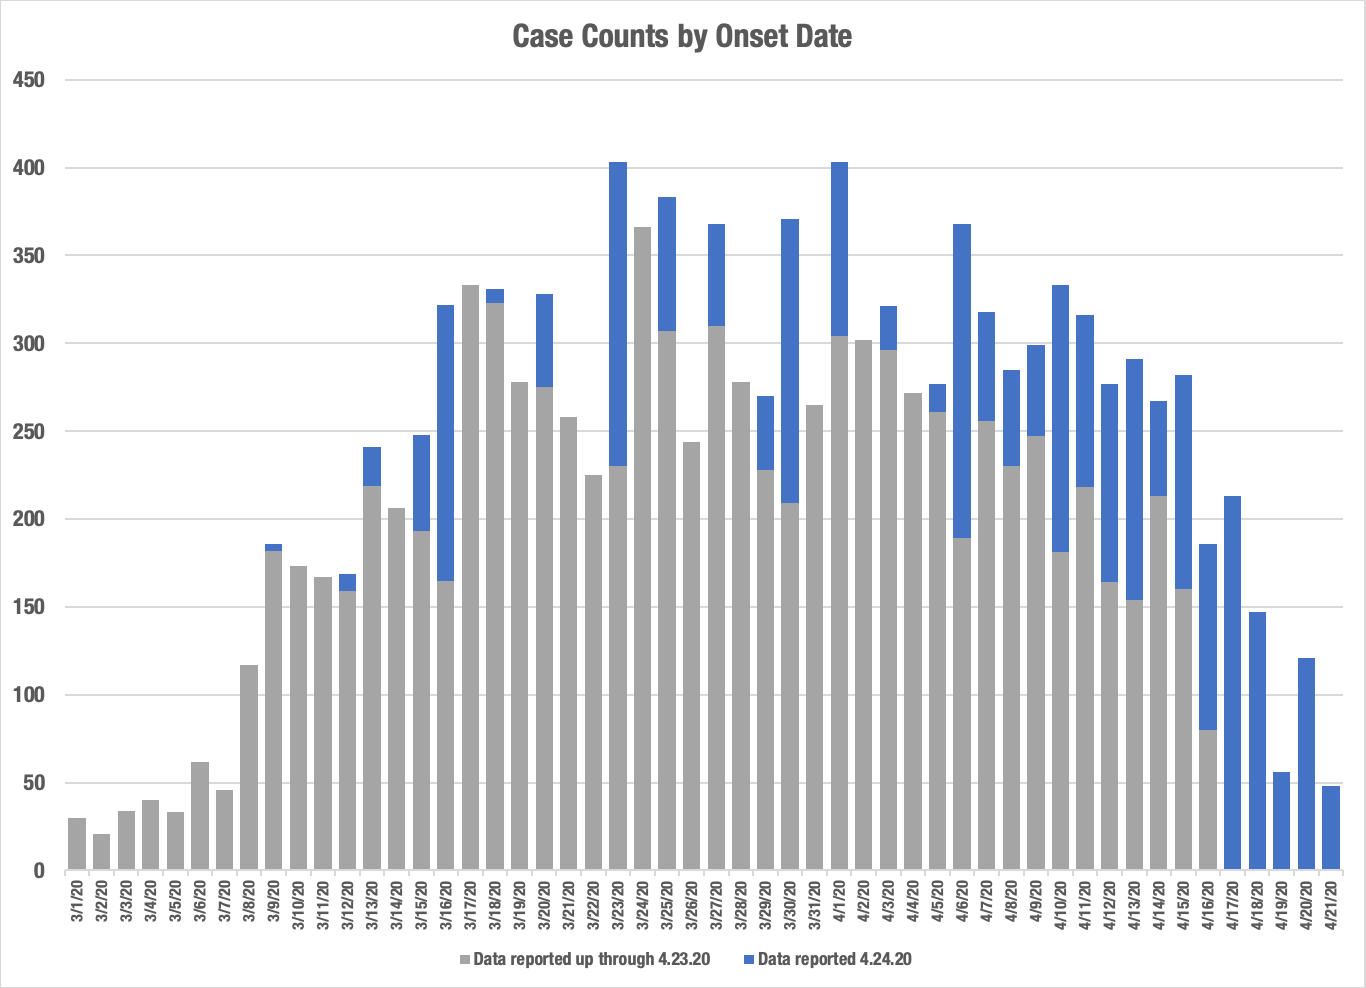
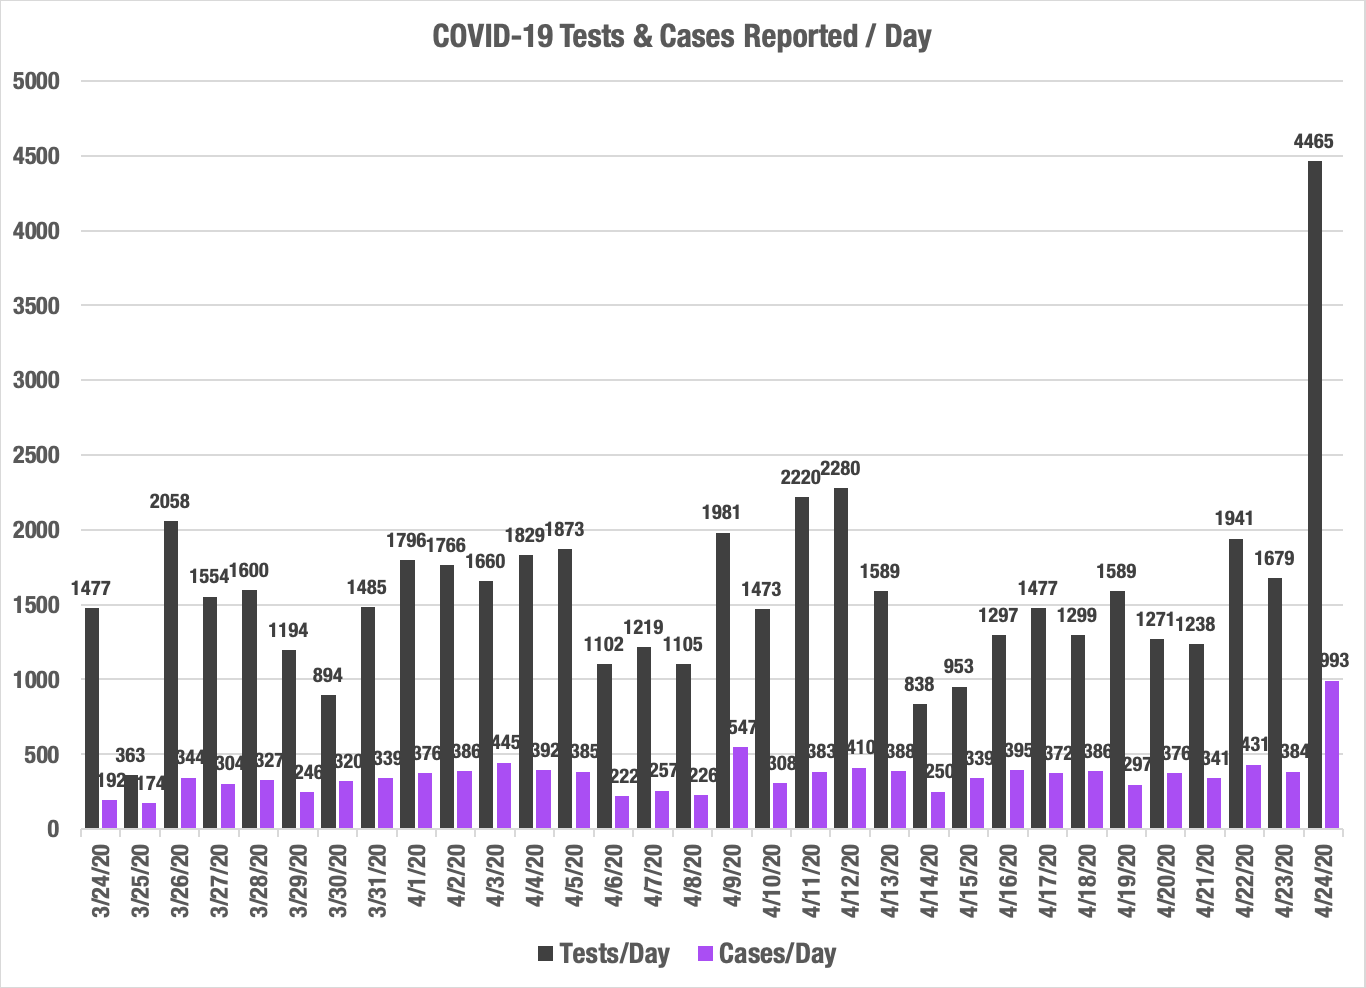
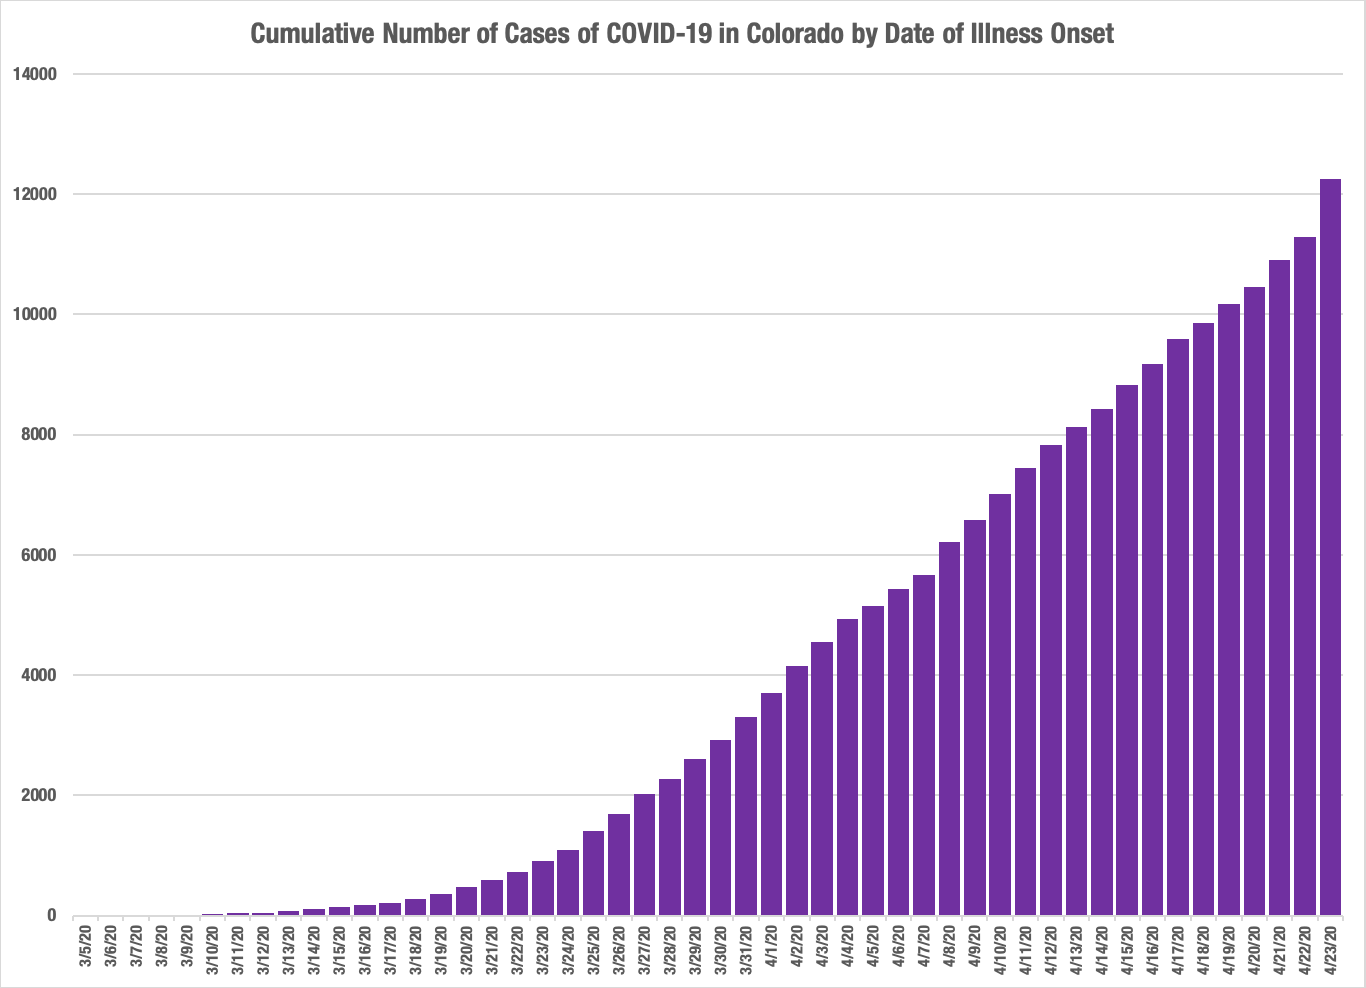
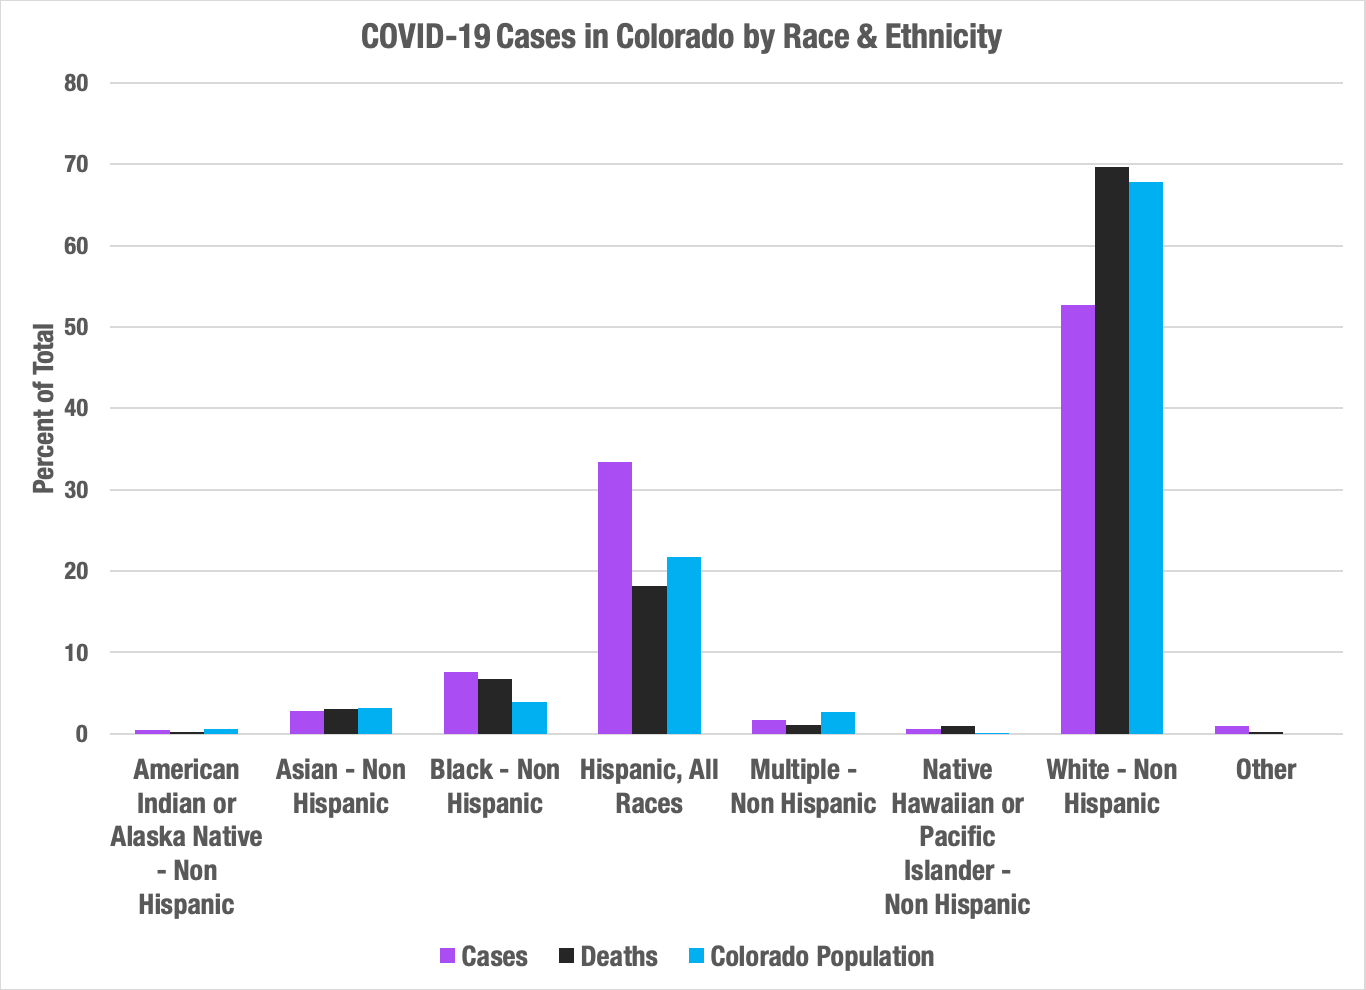
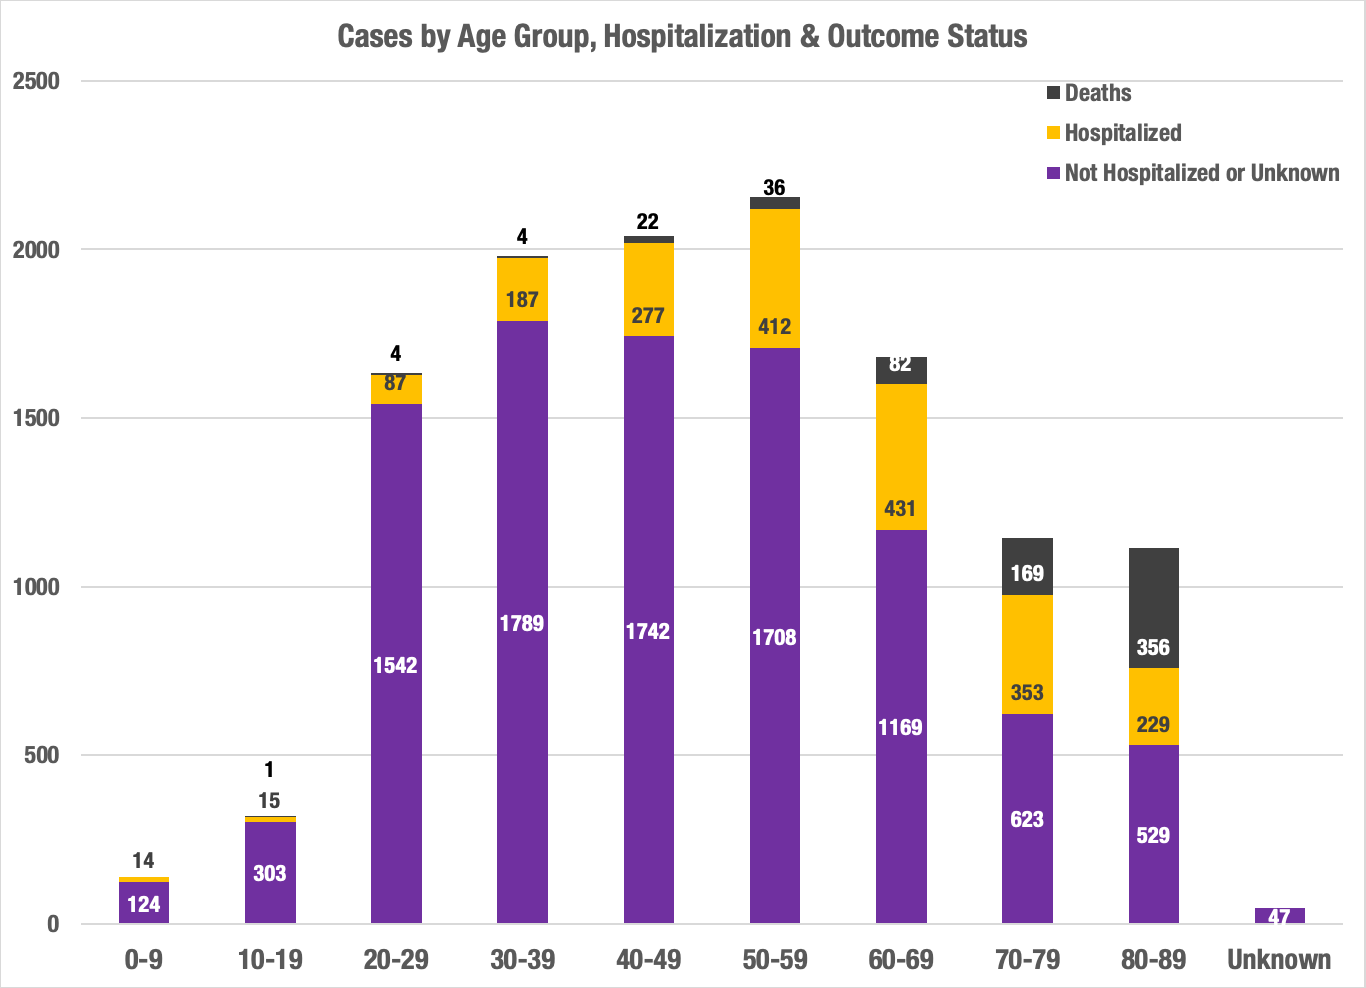
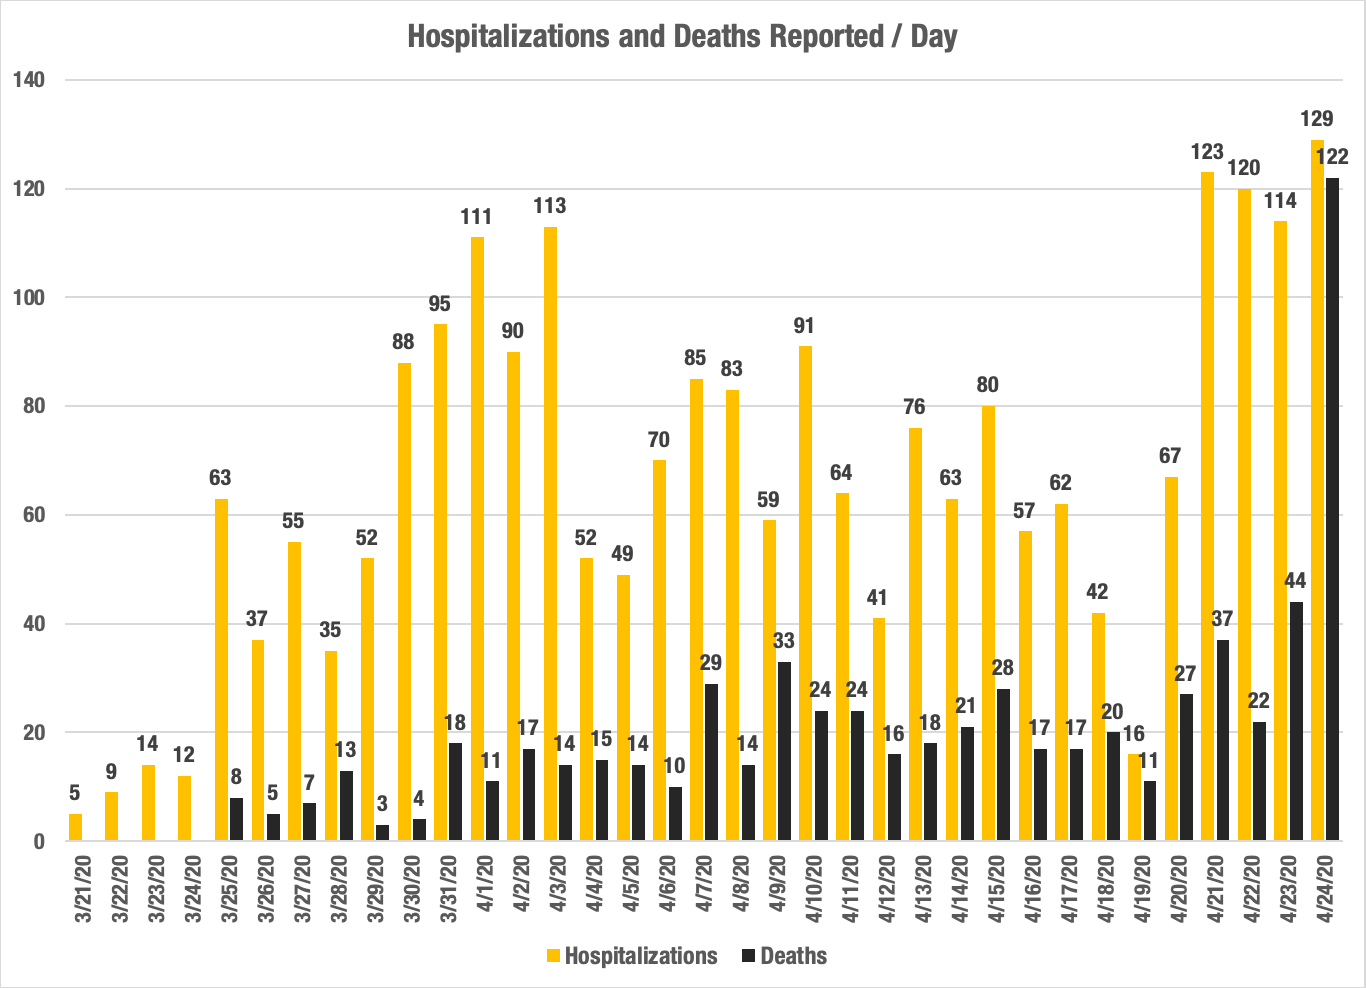
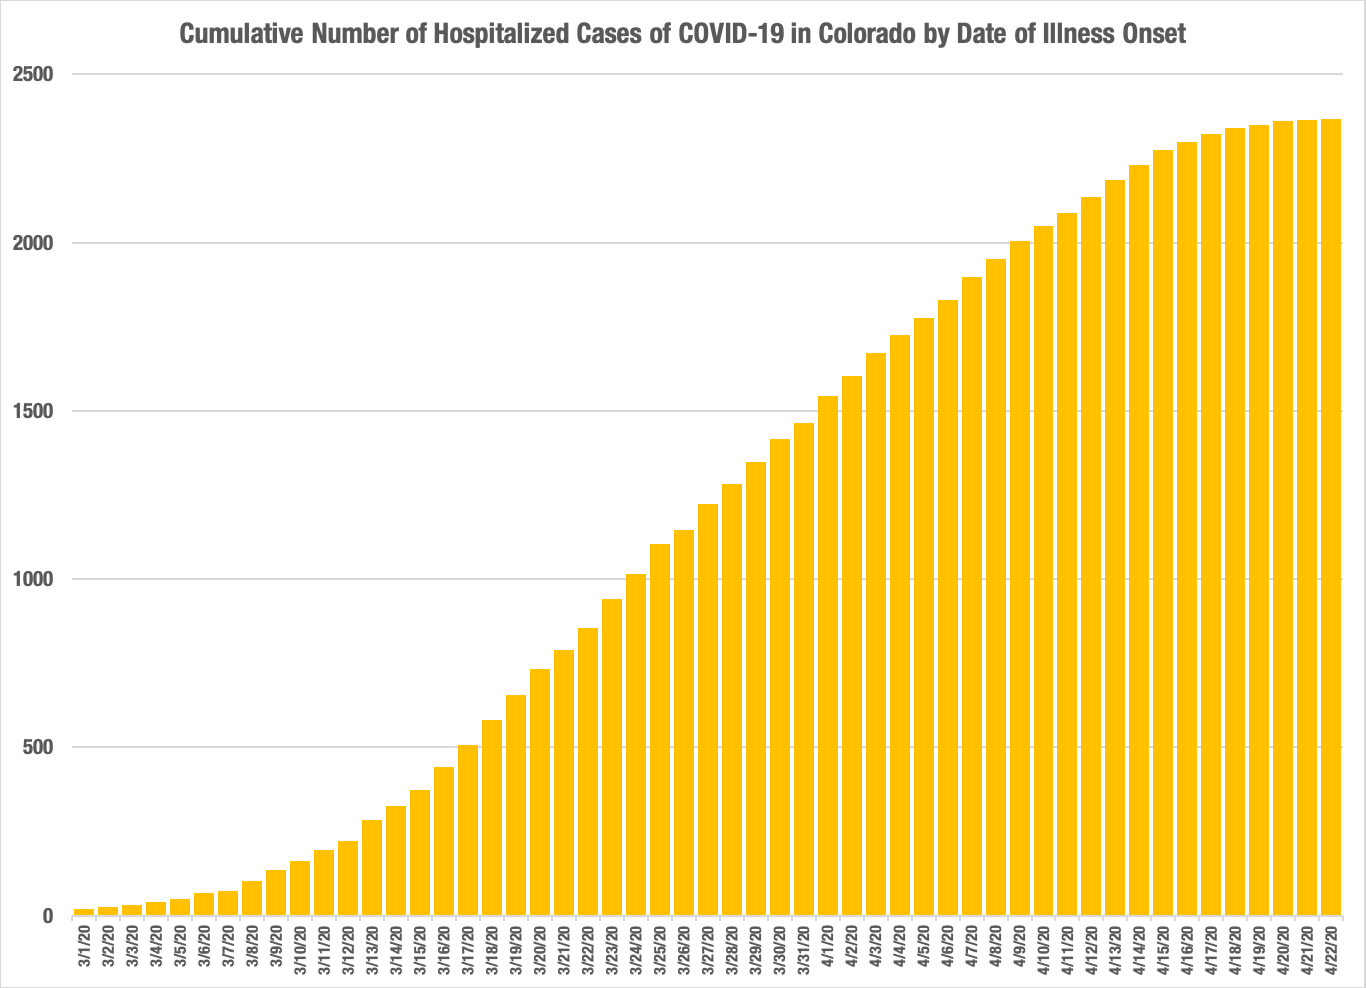
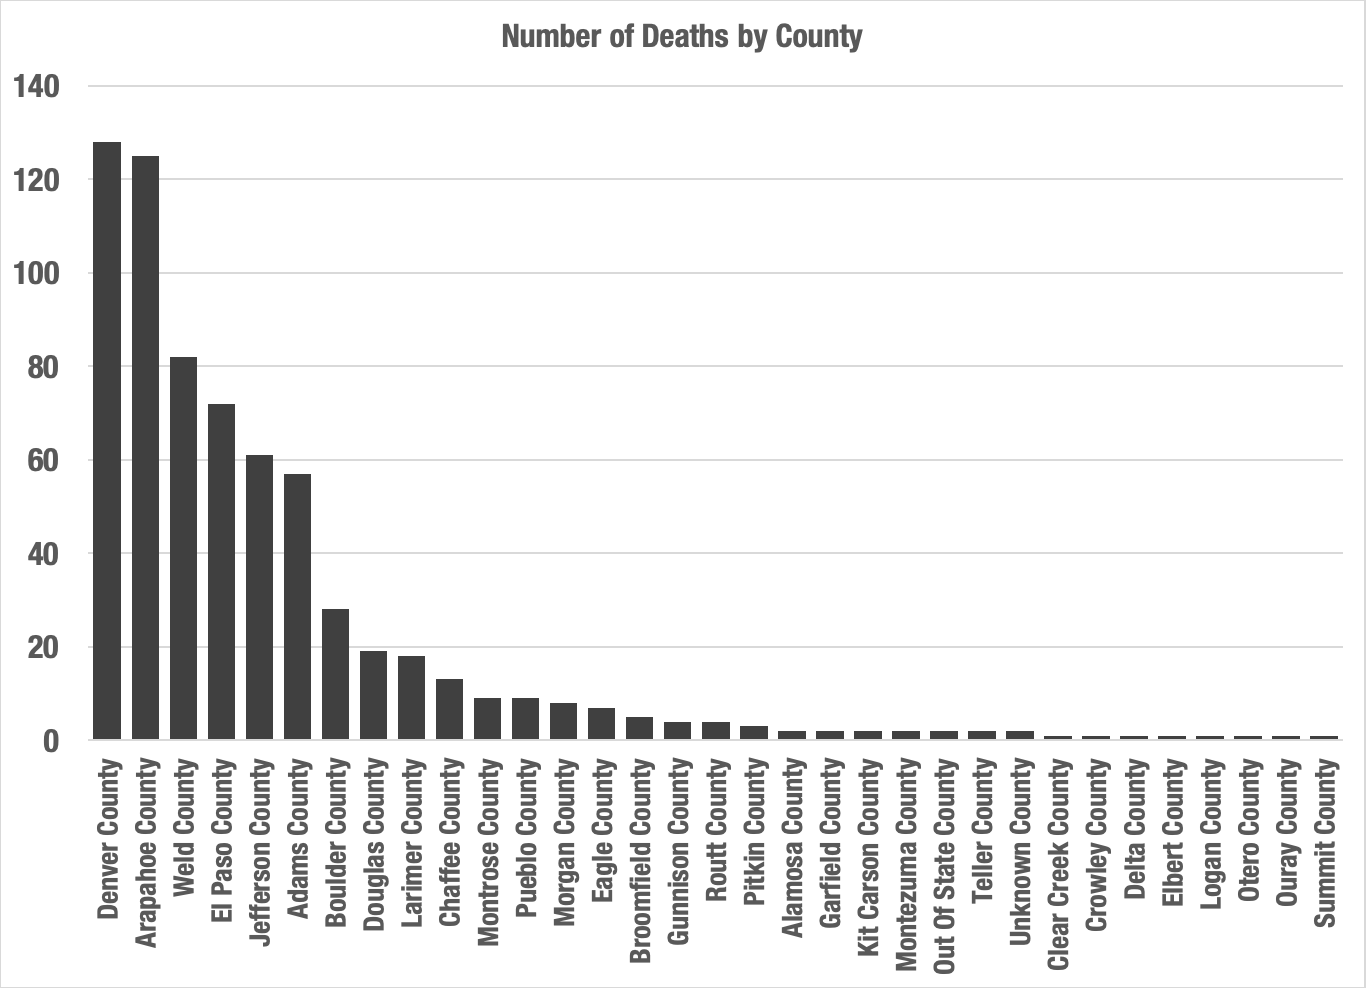
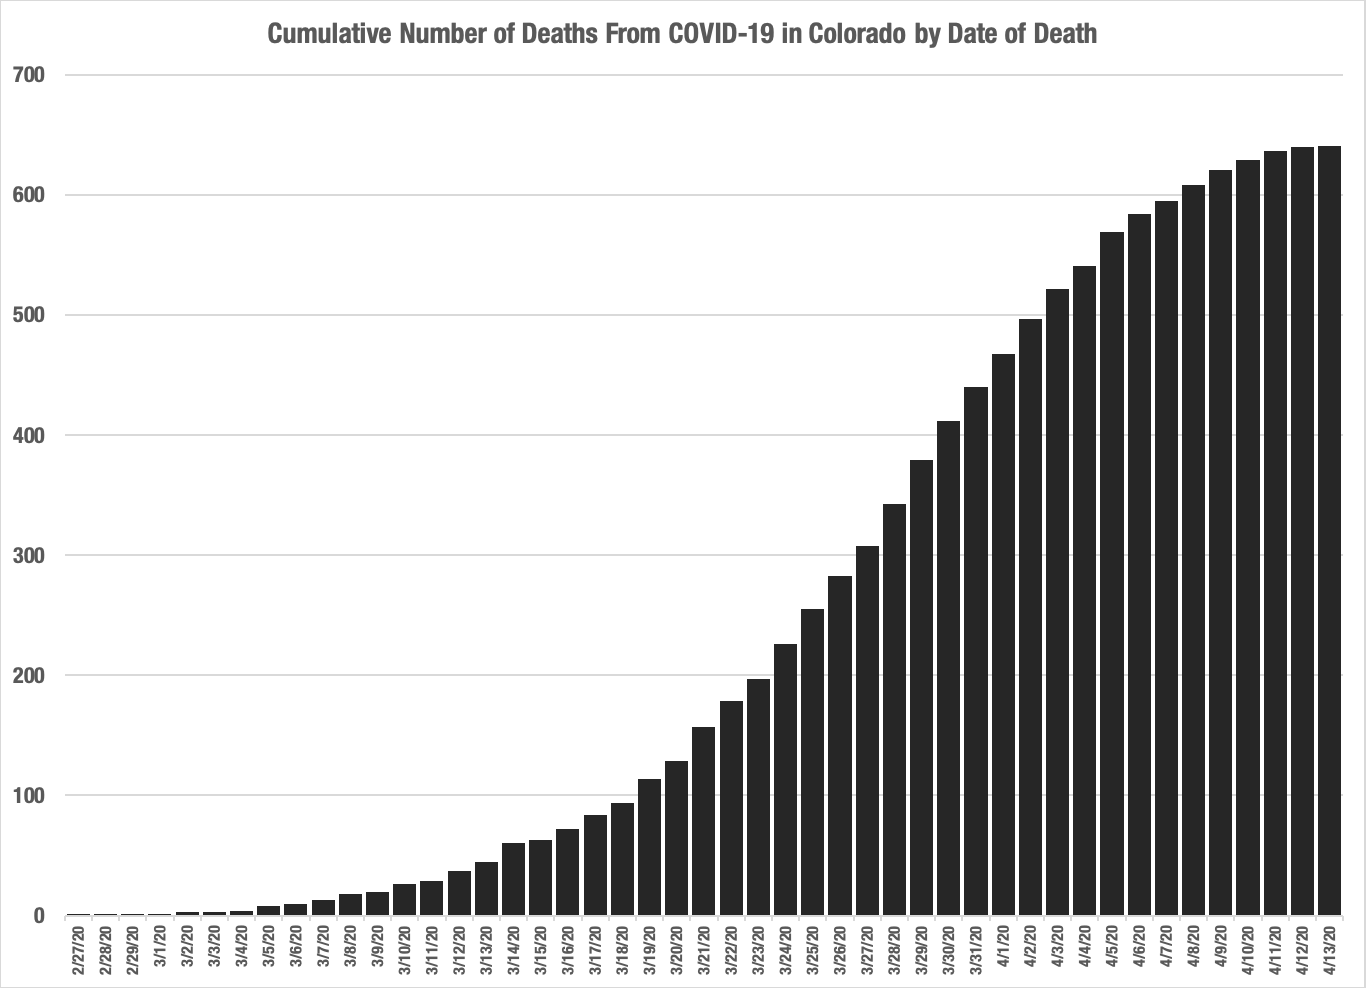
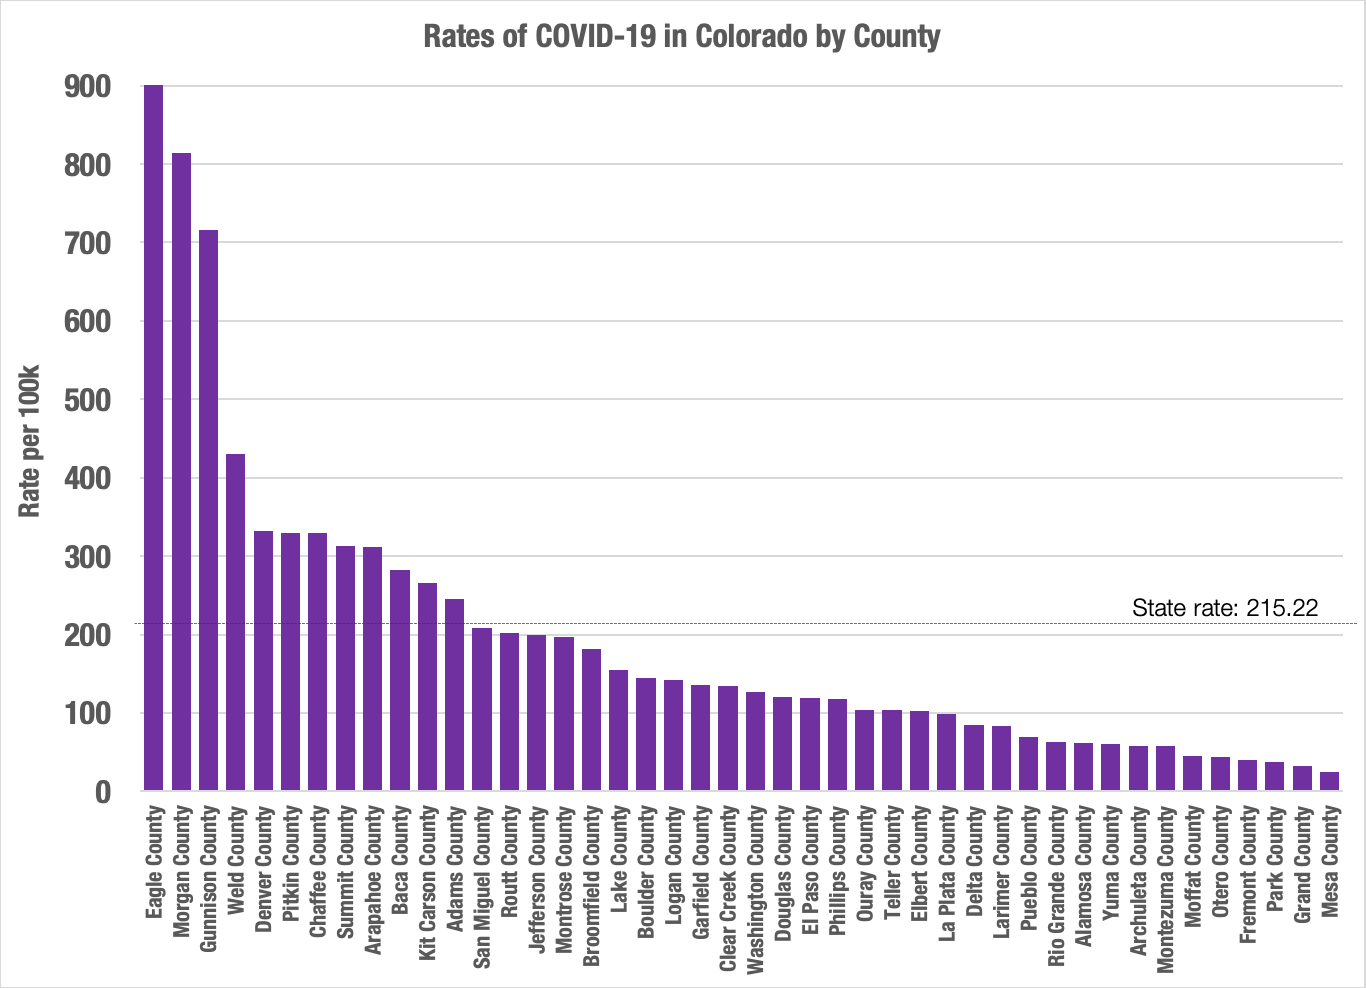
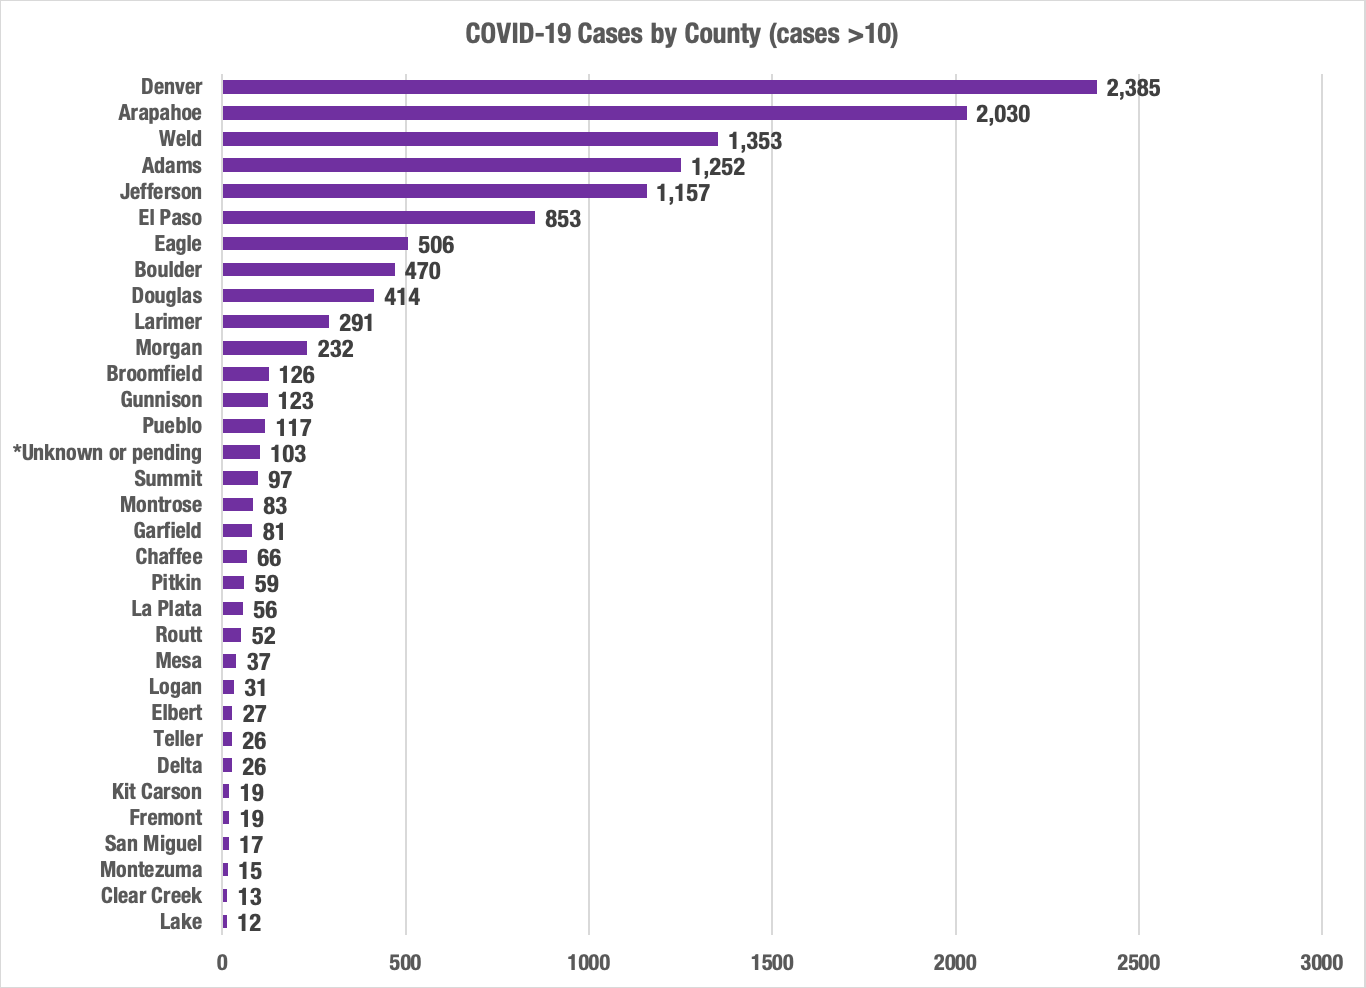
In the early days of the COVID-19 pandemic, Colorado did not have a data dashboard available. Every afternoon at 4:00pm, I created a series of charts to help visualize changes in confirmed cases, hospitalizations, and deaths.